


Monterrey (1-1) Pumas: resumen del partido
Sigue todas las acciones en directo minuto a minuto del Monterrey vs Pumas, partido correspondiente a la Jornada 13 este sábado 18 de octubre en punto de las 19:00 horas.

Final del partido, Monterrey 1, Pumas UNAM 1.
Final segunda parte, Monterrey 1, Pumas UNAM 1.
Falta de Tony Leone (Monterrey).
Rubén Duarte (Pumas UNAM) ha recibido una falta en la zona defensiva.
Sergio Canales (Monterrey) ha recibido una falta en campo contrario.
Falta de Rubén Duarte (Pumas UNAM).
Cambio en Pumas UNAM, entra al campo Santiago Trigos sustituyendo a Jorge Ruvalcaba.
Cambio en Pumas UNAM, entra al campo Pablo Monroy sustituyendo a Alan Medina.
Remate fallado por Roberto de la Rosa (Monterrey) remate con la derecha desde fuera del área que se pierde por la izquierda. Asistencia de Germán Berterame tras un contraataque.
Remate rechazado de Rubén Duarte (Pumas UNAM) remate con la izquierda desde fuera del área.
Corner,Pumas UNAM. Corner cometido por Luis Reyes.
El cuarto árbitro ha anunciado 5 minutos de tiempo añadido.
Corner,Pumas UNAM. Corner cometido por Tony Leone.
Falta de Roberto de la Rosa (Monterrey).
Alan Medina (Pumas UNAM) ha recibido una falta en campo contrario.
Cambio en Monterrey, entra al campo Tony Leone sustituyendo a Víctor Guzmán.
Cambio en Monterrey, entra al campo Roberto de la Rosa sustituyendo a Óliver Torres.
Lucas Ocampos (Monterrey) ha recibido una falta en la zona defensiva.
Falta de Jorge Ruvalcaba (Pumas UNAM).
Corner,Pumas UNAM. Corner cometido por Víctor Guzmán.
Falta de Iker Fimbres (Monterrey).
Pablo Bennevendo (Pumas UNAM) ha recibido una falta en la zona defensiva.
Remate fallado por Lucas Ocampos (Monterrey) remate con la izquierda desde el centro del área que se va alto y por la izquierda. Asistencia de Óliver Torres con un centro al área.
Iker Fimbres (Monterrey) ha recibido una falta en la banda izquierda.
Falta de Pablo Bennevendo (Pumas UNAM).
Falta de Iker Fimbres (Monterrey).
Pablo Bennevendo (Pumas UNAM) ha recibido una falta en la zona defensiva.
Remate parado junto al lado derecho de la portería. Germán Berterame (Monterrey) remate de cabeza desde el centro del área. Asistencia de Víctor Guzmán con un centro al área.
Remate fallado por Sergio Canales (Monterrey) remate con la izquierda desde el centro del área muy cerca del palo izquierdo pero se marchó ligeramente desviado. Asistencia de Iker Fimbres.
Se reanuda el partido.
El juego está detenido (Monterrey).
Se reanuda el partido.
El juego está detenido debido a una lesión Alan Medina (Pumas UNAM).
Fuera de juego, Monterrey. Luis Reyes intentó un pase en profundidad pero Sergio Canales estaba en posición de fuera de juego.
Corner,Monterrey. Corner cometido por Nathan Silva.
Remate rechazado de Jorge Ruvalcaba (Pumas UNAM) remate con la derecha desde el centro del área. Asistencia de Álvaro Angulo.
Remate parado bajo palos a rás de suelo. Iker Fimbres (Monterrey) remate con la derecha desde fuera del área. Asistencia de Luis Reyes.
Remate fallado por Jorge Ruvalcaba (Pumas UNAM) remate con la derecha desde fuera del área sale rozando la escuadra derecha. Asistencia de Álvaro Angulo tras un contraataque.
Cambio en Pumas UNAM, entra al campo Rodrigo López sustituyendo a Adalberto Carrasquilla.
Falta de Lucas Ocampos (Monterrey).
José Caicedo (Pumas UNAM) ha recibido una falta en la zona defensiva.
Iker Fimbres (Monterrey) ha recibido una falta en la zona defensiva.
Falta de Alan Medina (Pumas UNAM).
Remate fallado por Sergio Canales (Monterrey) remate con la izquierda desde fuera del área que se le va demasiado alto. Asistencia de Víctor Guzmán.
Fuera de juego, Pumas UNAM. Álvaro Angulo intentó un pase en profundidad pero Jorge Ruvalcaba estaba en posición de fuera de juego.
Remate fallado por Germán Berterame (Monterrey) remate de cabeza desde el centro del área que se le va demasiado alto. Asistencia de Sergio Canales con un centro al área tras un saque de esquina.
Corner,Monterrey. Corner cometido por Angel Azuaje.
Remate rechazado de Adalberto Carrasquilla (Pumas UNAM) remate con la derecha desde fuera del área.
Remate rechazado de Santiago López (Pumas UNAM) remate con la izquierda desde el centro del área.
Remate rechazado de Jorge Ruvalcaba (Pumas UNAM) remate con la izquierda desde el centro del área.
Remate fallado por Germán Berterame (Monterrey) remate con la izquierda desde el centro del área que se va alto y desviado por la derecha. Asistencia de Óliver Torres.
Se reanuda el partido.
El juego está detenido debido a una lesión Nathan Silva (Pumas UNAM).
Sergio Canales (Monterrey) ha recibido una falta en la banda derecha.
Falta de Rubén Duarte (Pumas UNAM).
Remate rechazado de Álvaro Angulo (Pumas UNAM) remate con la izquierda desde el lado izquierdo del interior del área. Asistencia de Jorge Ruvalcaba.
Gerardo Arteaga (Monterrey) ha recibido una falta en la banda izquierda.
Falta de Alan Medina (Pumas UNAM).
Cambio en Monterrey, entra al campo Iker Fimbres sustituyendo a Héctor Moreno.
Cambio en Monterrey, entra al campo Jorge Rodríguez sustituyendo a Anthony Martial.
Empieza segunda parte Monterrey 1, Pumas UNAM 1.
Final primera parte, Monterrey 1, Pumas UNAM 1.
Corner,Pumas UNAM. Corner cometido por Sergio Ramos.
¡Gooooool! Monterrey 1, Pumas UNAM 1. Sergio Ramos (Monterrey) convirtió el penalti remate con la derecha por el lado derecho de la portería.
Decisión del VAR: Penalti Monterrey.
Penalti a favor del Monterrey. Sergio Ramos sufrió falta en el área.
Penalti cometido por Rubén Duarte (Pumas UNAM) tras una falta dentro del área.
Corner,Monterrey. Corner cometido por Angel Azuaje.
Remate rechazado de Lucas Ocampos (Monterrey) remate con la derecha desde el centro del área. Asistencia de Germán Berterame con un pase de cabeza.
Óliver Torres (Monterrey) ha recibido una falta en la zona defensiva.
Falta de Adalberto Carrasquilla (Pumas UNAM).
Fuera de juego, Monterrey. Víctor Guzmán intentó un pase en profundidad pero Sergio Canales estaba en posición de fuera de juego.
El cuarto árbitro ha anunciado 7 minutos de tiempo añadido.
Remate rechazado de Germán Berterame (Monterrey) remate con la derecha desde fuera del área.
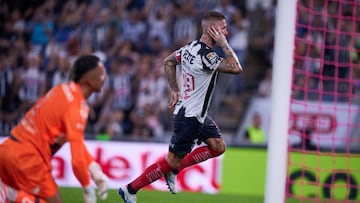
¡Gooooool! Monterrey 0, Pumas UNAM 1. Alan Medina (Pumas UNAM) remate con la derecha desde el lado izquierdo del interior del área a la escuadra derecha. Asistencia de Jorge Ruvalcaba.
Remate fallado por Álvaro Angulo (Pumas UNAM) remate con la izquierda desde fuera del área el balón se pierde por el lado derecho de la portería. Asistencia de Adalberto Carrasquilla.
Se reanuda el partido.
El juego está detenido debido a una lesión Rubén Duarte (Pumas UNAM).
Remate parado bajo palos a rás de suelo. Lucas Ocampos (Monterrey) remate con la derecha desde fuera del área. Asistencia de Óliver Torres.
Se reanuda el partido.
El juego está detenido debido a una lesión Santiago Mele (Monterrey).
El juego está detenido debido a una lesión Santiago López (Pumas UNAM).
Cambio en Pumas UNAM, entra al campo Santiago López sustituyendo a José Macías debido a una lesión.
Se reanuda el partido.
El juego está detenido debido a una lesión José Macías (Pumas UNAM).
Corner,Pumas UNAM. Corner cometido por Sergio Ramos.
Falta de Lucas Ocampos (Monterrey).
Jorge Ruvalcaba (Pumas UNAM) ha recibido una falta en la zona defensiva.
Mano de Adalberto Carrasquilla (Pumas UNAM).
Falta de Luis Reyes (Monterrey).
Alan Medina (Pumas UNAM) ha recibido una falta en la zona defensiva.
Remate rechazado de Germán Berterame (Monterrey) remate de cabeza desde el centro del área.
Falta de Sergio Ramos (Monterrey).
Alan Medina (Pumas UNAM) ha recibido una falta en la zona defensiva.
Remate rechazado de Germán Berterame (Monterrey) remate con la derecha a quemarropa desde el lado izquierdo.
Anthony Martial (Monterrey) ha recibido una falta en la banda izquierda.
Falta de José Caicedo (Pumas UNAM).
Se reanuda el partido.
El juego está detenido debido a una lesión Héctor Moreno (Monterrey).
Luis Reyes (Monterrey) ha recibido una falta en la zona defensiva.
Falta de Alan Medina (Pumas UNAM).
Remate rechazado de Jorge Ruvalcaba (Pumas UNAM) remate con la derecha desde fuera del área. Asistencia de José Macías.
Remate parado junto al lado derecho de la portería. José Macías (Pumas UNAM) remate con la derecha desde fuera del área. Asistencia de Rubén Duarte.
Rubén Duarte (Pumas UNAM) ha visto tarjeta amarilla por juego peligroso.
Óliver Torres (Monterrey) ha recibido una falta en la zona defensiva.
Falta de Rubén Duarte (Pumas UNAM).
Corner,Pumas UNAM. Corner cometido por Sergio Ramos.
Remate rechazado de Adalberto Carrasquilla (Pumas UNAM) remate con la derecha desde fuera del área. Asistencia de Jorge Ruvalcaba.
Remate rechazado de Alan Medina (Pumas UNAM) remate con la derecha desde el centro del área.
Corner,Pumas UNAM. Corner cometido por Víctor Guzmán.
Germán Berterame (Monterrey) ha recibido una falta en la zona defensiva.
Falta de Angel Azuaje (Pumas UNAM).
Corner,Pumas UNAM. Corner cometido por Óliver Torres.
Remate rechazado de José Caicedo (Pumas UNAM) remate con la derecha desde fuera del área.
Fuera de juego, Pumas UNAM. José Macías intentó un pase en profundidad pero Adalberto Carrasquilla estaba en posición de fuera de juego.
Lucas Ocampos (Monterrey) ha recibido una falta en la zona defensiva.
Falta de Nathan Silva (Pumas UNAM).
Empieza primera parte.
Alineaciones confirmadas por parte de ambos equipos, que saltan al campo para iniciar los ejercicios de calentamiento
Rellene su nombre y apellidos para comentar