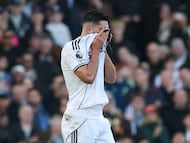
Raúl Jiménez rompe en llanto después del partido del Fulham
Marcos Olvera |
| Pos. | Equipo | Balones disputados |
|---|---|---|
| 1 |
|
4051 |
| 2 |
|
4010 |
| 3 |
|
3968 |
| 4 |
|
3936 |
| 5 |
|
3921 |
| 6 |
|
3895 |
| 7 |
|
3879 |
| 8 |
|
3823 |
| 9 |
|
3800 |
| 10 |
|
3779 |
| 11 |
|
3729 |
| 12 |
|
3713 |
| 13 |
|
3707 |
| 14 |
|
3627 |
| 15 |
|
3619 |
| 16 |
|
3602 |
| 17 |
|
3580 |
| 18 |
|
3471 |
| 19 |
|
3468 |
| 20 |
|
3108 |
Actualizado a las